> ## Documentation Index
> Fetch the complete documentation index at: https://wb-21fd5541-docs-1917.mintlify.site/llms.txt
> Use this file to discover all available pages before exploring further.
# 모델 비교 및 순위 매기기
> 평가 메트릭을 기반으로 다양한 모델 버전을 비교하고 순위를 매깁니다
Weave \_Leaderboards\_를 사용하면 여러 메트릭에 걸쳐 여러 모델을 평가하고 비교하여 정확도, 생성 품질, 지연 시간 또는 맞춤형 평가 로직을 측정할 수 있습니다. 리더보드를 사용하면 한곳에서 모델 성능을 시각화하고, 시간에 따른 변화를 추적하며, 팀 전체 벤치마크에 대한 합의를 이끌어낼 수 있습니다.
리더보드는 다음과 같은 경우에 적합합니다.
* 모델 성능 저하 추적
* 공유 평가 워크플로 조율
리더보드 생성은 Weave UI와 Weave Python SDK에서만 지원됩니다. TypeScript 사용자는 [Weave UI](#using-the-ui)를 사용해 리더보드를 생성하고 관리할 수 있습니다.
## 리더보드 생성
[Weave UI](#ui) 또는 [프로그래밍 방식으로](#python) 리더보드를 생성할 수 있습니다.
### UI 사용
Weave UI에서 직접 리더보드를 만들고 사용자 지정하려면 다음과 같이 하세요.
1. Weave UI에서 **Leaders** 섹션으로 이동합니다. 보이지 않으면 **More** → **Leaders**를 클릭합니다.
2. **+ New Leaderboard**를 클릭합니다.
3. **Leaderboard Title** 필드에 설명적인 이름(예: `summarization-benchmark-v1`)을 입력합니다.
4. 필요에 따라 이 리더보드에서 무엇을 비교하는지 설명하는 내용을 추가합니다.
5. 표시할 평가와 메트릭을 정의하려면 [열 추가](#add-columns)를 수행합니다.
6. 레이아웃이 마음에 들면 리더보드를 저장하고 게시하여 다른 사람과 공유합니다.
#### 열 추가
리더보드의 각 열은 특정 평가의 메트릭을 나타냅니다. 열을 설정하려면 다음을 지정합니다.
* **평가**: 드롭다운에서 평가 run을 선택합니다(미리 생성되어 있어야 함).
* **Scorer**: 해당 평가에 사용된 채점 함수(예: `jaccard_similarity`, `simple_accuracy`)를 선택합니다.
* **메트릭**: 표시할 summary 메트릭(예: `mean`, `true_fraction` 등)을 선택합니다.
열을 더 추가하려면 **Add Column**을 클릭합니다.
열을 편집하려면 오른쪽의 **액션 ()** 메뉴를 클릭합니다. 다음 작업을 할 수 있습니다.
* **앞 / 뒤로 이동** – 열 순서를 변경합니다
* **복제** – 열 정의를 복사합니다
* **삭제** – 열을 제거합니다
* **오름차순 정렬** – 리더보드의 기본 정렬을 설정합니다(다시 클릭하면 내림차순으로 전환됨)
### Python
바로 실행할 수 있는 전체 코드 예제가 필요하신가요? [엔드투엔드 Python 예제](#end-to-end-python-example)를 참조하세요.
리더보드를 생성하고 게시하려면 다음과 같이 하세요.
1. 테스트 데이터셋을 정의합니다. 기본 제공 [`Dataset`](./datasets)을 사용하거나, 입력과 타깃 목록을 직접 정의할 수 있습니다:
```python lines theme={null}
dataset = [
{"input": "...", "target": "..."},
...
]
```
2. 하나 이상의 [scorers](../evaluation/scorers)를 정의합니다:
```python lines theme={null}
@weave.op
def jaccard_similarity(target: str, output: str) -> float:
...
```
3. [`Evaluation`](../core-types/evaluations)을 생성합니다:
```python lines theme={null}
evaluation = weave.Evaluation(
name="My Eval",
dataset=dataset,
scorers=[jaccard_similarity],
)
```
4. 평가할 모델을 정의합니다:
```python lines theme={null}
@weave.op
def my_model(input: str) -> str:
...
```
5. 평가를 실행합니다:
```python lines theme={null}
async def run_all():
await evaluation.evaluate(model_vanilla)
await evaluation.evaluate(model_humanlike)
await evaluation.evaluate(model_messy)
asyncio.run(run_all())
```
6. 리더보드를 생성합니다:
```python lines theme={null}
spec = leaderboard.Leaderboard(
name="My Leaderboard",
description="Evaluating models on X task",
columns=[
leaderboard.LeaderboardColumn(
evaluation_object_ref=get_ref(evaluation).uri(),
scorer_name="jaccard_similarity",
summary_metric_path="mean",
)
]
)
```
7. 리더보드를 게시합니다.
```python lines theme={null}
weave.publish(spec)
```
8. 결과를 조회합니다:
```python lines theme={null}
results = leaderboard.get_leaderboard_results(spec, client)
print(results)
```
## End-to-End Python 예제
다음 예제에서는 Weave Evaluations를 사용해 맞춤형 메트릭으로 공유 데이터셋에서 세 가지 요약 모델을 비교하는 리더보드를 만듭니다. 작은 벤치마크를 만든 뒤 각 모델을 평가하고, [Jaccard similarity](https://www.learndatasci.com/glossary/jaccard-similarity/)로 각 모델의 점수를 매긴 다음, 결과를 Weave 리더보드에 게시합니다.
```python lines theme={null}
import weave
from weave.flow import leaderboard
from weave.trace.ref_util import get_ref
import asyncio
client = weave.init("leaderboard-demo")
dataset = [
{
"input": "Weave is a tool for building interactive LLM apps. It offers observability, trace inspection, and versioning.",
"target": "Weave helps developers build and observe LLM applications."
},
{
"input": "The OpenAI GPT-4o model can process text, audio, and vision inputs, making it a multimodal powerhouse.",
"target": "GPT-4o is a multimodal model for text, audio, and images."
},
{
"input": "The W&B team recently added native support for agents and evaluations in Weave.",
"target": "W&B added agents and evals to Weave."
}
]
@weave.op
def jaccard_similarity(target: str, output: str) -> float:
target_tokens = set(target.lower().split())
output_tokens = set(output.lower().split())
intersection = len(target_tokens & output_tokens)
union = len(target_tokens | output_tokens)
return intersection / union if union else 0.0
evaluation = weave.Evaluation(
name="Summarization Quality",
dataset=dataset,
scorers=[jaccard_similarity],
)
@weave.op
def model_vanilla(input: str) -> str:
return input[:50]
@weave.op
def model_humanlike(input: str) -> str:
if "Weave" in input:
return "Weave helps developers build and observe LLM applications."
elif "GPT-4o" in input:
return "GPT-4o supports text, audio, and vision input."
else:
return "W&B added agent support to Weave."
@weave.op
def model_messy(input: str) -> str:
return "Summarizer summarize models model input text LLMs."
async def run_all():
await evaluation.evaluate(model_vanilla)
await evaluation.evaluate(model_humanlike)
await evaluation.evaluate(model_messy)
asyncio.run(run_all())
spec = leaderboard.Leaderboard(
name="Summarization Model Comparison",
description="Evaluate summarizer models using Jaccard similarity on 3 short samples.",
columns=[
leaderboard.LeaderboardColumn(
evaluation_object_ref=get_ref(evaluation).uri(),
scorer_name="jaccard_similarity",
summary_metric_path="mean",
)
]
)
weave.publish(spec)
results = leaderboard.get_leaderboard_results(spec, client)
print(results)
```
### 리더보드 보기 및 해석
스크립트 실행이 끝나면 리더보드를 확인합니다:
1. **Weave UI**에서 **Leaders** 탭으로 이동합니다. 보이지 않으면 **More**를 클릭한 다음 **Leaders**를 선택합니다.
2. 리더보드 이름(예: `Summarization Model Comparison`)을 클릭합니다.
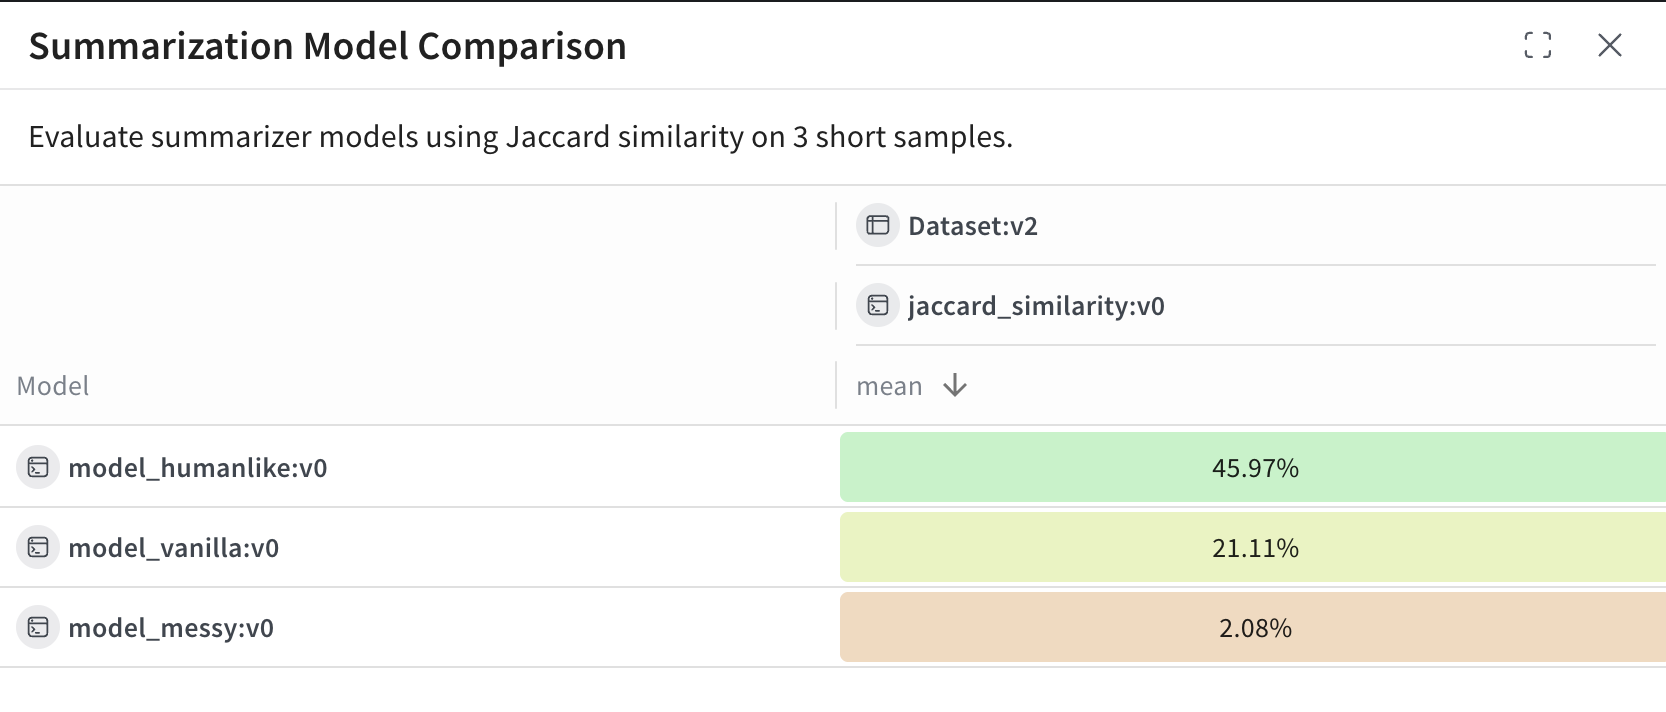
리더보드 테이블에서 각 행은 특정 모델(`model_humanlike`, `model_vanilla`, `model_messy`)을 나타냅니다. `mean` 열은 모델의 출력과 레퍼런스 요약 간의 평균 Jaccard 유사도를 보여줍니다.
 이 예제에서는:
* `model_humanlike`가 약 \~46%의 중첩률로 가장 좋은 성능을 보입니다.
* `model_vanilla`(단순한 잘라내기 방식)는 약 \~21%를 기록합니다.
* `model_messy`는 의도적으로 성능이 나쁘게 만든 모델로, 약 \~2%의 점수를 기록합니다.
이 예제에서는:
* `model_humanlike`가 약 \~46%의 중첩률로 가장 좋은 성능을 보입니다.
* `model_vanilla`(단순한 잘라내기 방식)는 약 \~21%를 기록합니다.
* `model_messy`는 의도적으로 성능이 나쁘게 만든 모델로, 약 \~2%의 점수를 기록합니다.